How to create Chart in Aranet Cloud?

aranet-techsupport
Posted: 25.05.2021 11:21
Modified: 03.03.2026 09:38
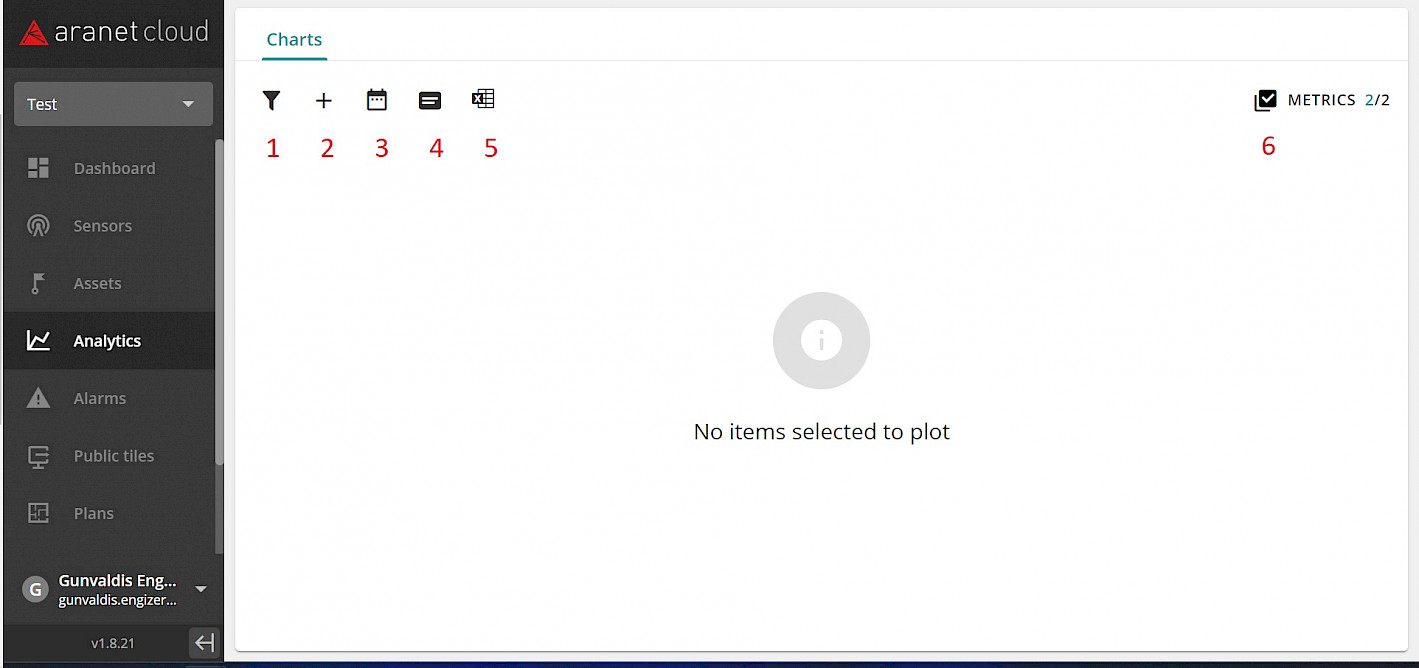
Login to aranet.cloud and navigate to ANALYTICS menu.
- If connected sensors number is big, pressing Filter button
 you can filter them by Sensor type or Tags.
 - Click on Sensors button
 and select up to 10 sensors from the list.
 - Select period of time by pressing Time Filter button
 . Max time period is 30 days.
 - By pressing Toggle Legend
 button you can enable or disable displaying Graph's legend.
 - By pressing Download charts as Excel file. Excel file with selected period is downloaded.
- Select metrics to display by pressing Metrics button
 . Two metrics can be displayed simultaneously.
 - You can adjust generated chart by moving rulers on the Time axis.
- By clicking right mouse button on the graph you can save it to your PC as an image.
- If connected sensors number is big, pressing Filter button
You have to log in to reply.