Analytics - Trends tab
aranet-techsupport
Posted: 15.04.2025 06:59
Modified: 03.03.2026 07:42
Starting from Aranet Cloud version v2.6.4 there is a new tab in Analytics called Trends.
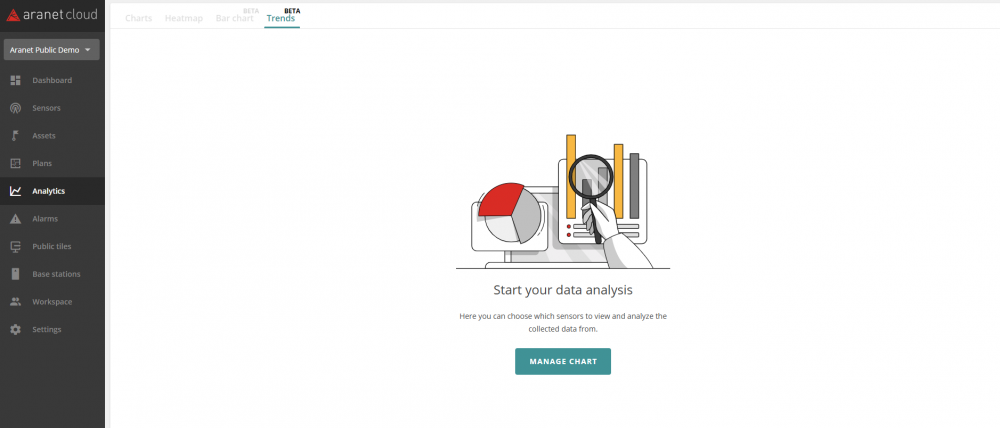
Here you can find a couple of options to choose from:
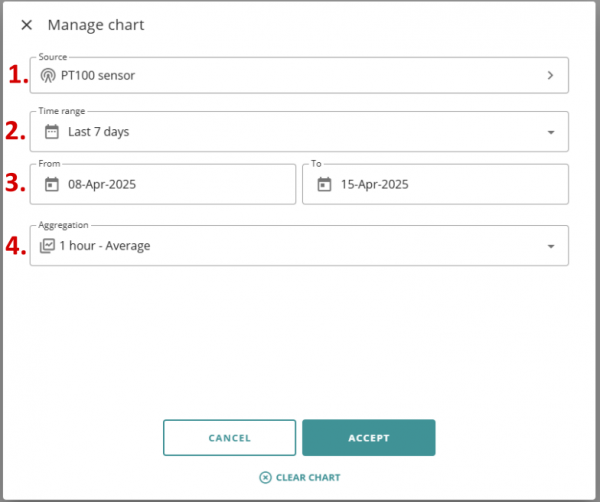
- The source of the data: You can choose any sensors or asset that you would like to display the data.
- The time range: Choose up to 30 days to display the data
- You can change the time frame here if you want to have a more specific time frame
- The data aggregation. You have a few options here:
- Raw data: Shows just the raw data.
- Hourly (Minimum, Maximum, average): Data is aggregated hourly, showing the minimum, maximum or average values.
- Daily (Minimum, Maximum, average): Data is aggregated daily, showing the minimum, maximum or average values.
When accepted, you will get something like this.
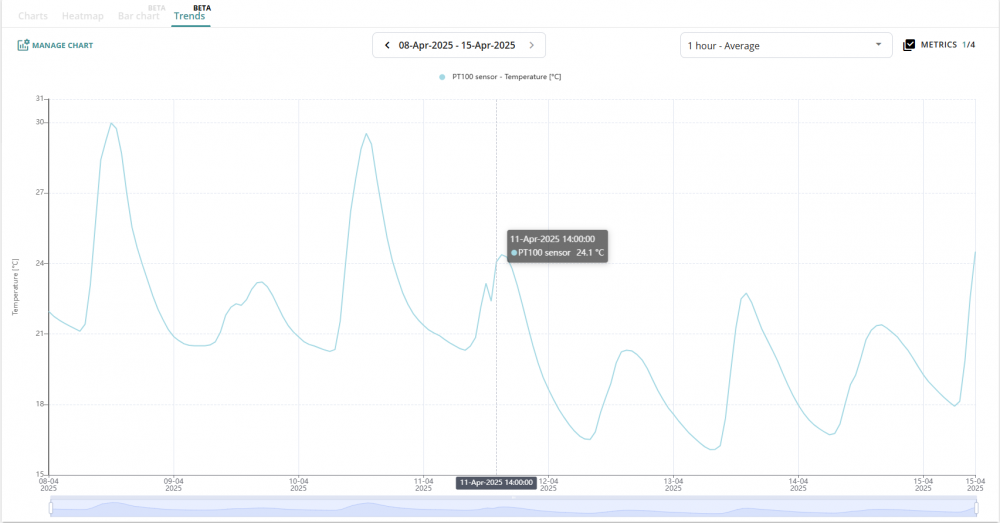
Trends can be used to see the minimal values if you got a large spike (like breathing on a Co2 sensor) or average values to better smooth out the curve.
You have to log in to reply.